Metrics and Monitoring diagram template
Collect, store, query and alert on time-series metrics from a fleet of services.
About this design
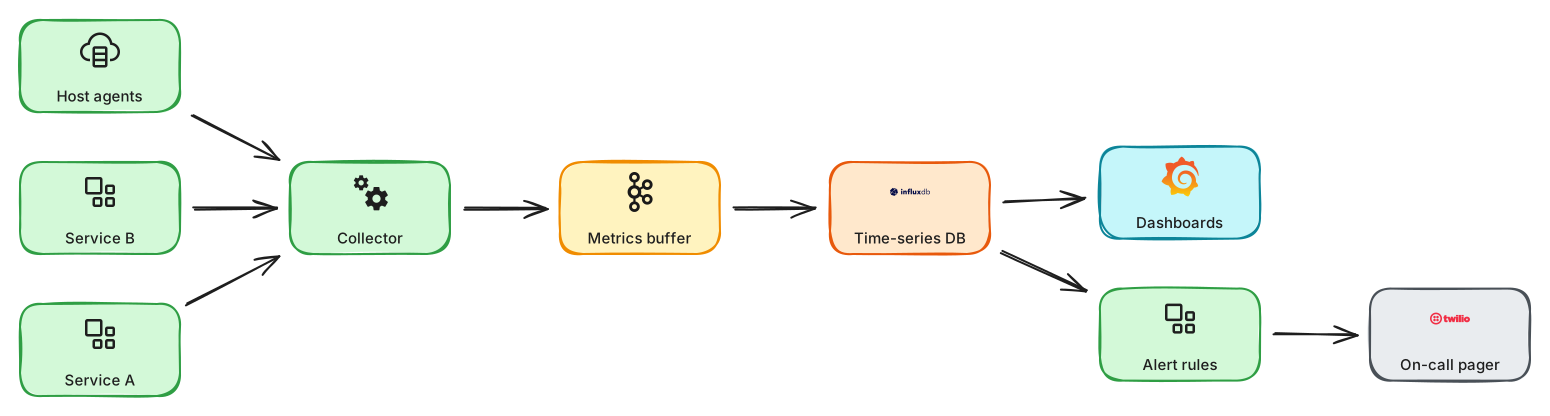
Monitoring is itself a distributed system with a write path far heavier than its read path. Agents on every host and sidecars in every service push or expose counters and gauges; a collector tier batches them and writes to a time-series database, usually after passing through a queue that absorbs bursts. Storage downsamples old data, keeping per-second detail for hours and per-minute rollups for months, because nobody needs last year at full resolution. A query layer powers dashboards, while a separate rules engine evaluates alert conditions continuously and sends pages through an on-call tool. The template invites discussion of cardinality explosions from badly chosen labels, pull versus push collection, how to monitor the monitor, and why alerting should be on symptoms users feel rather than every internal metric that wobbles.
Diagram as text
This is the source of the diagram, in the ArchBoard diagram DSL. Paste it into Tools, Diagram from text to rebuild or change it.
title "Metrics and monitoring"
direction LR
service a "Service A" -> worker collect "Collector"
service b "Service B" -> collect
node host "Host agents" -> collect
collect -> queue kafka "Metrics buffer" -> db influxdb "Time-series DB"
time-series-db -> monitor grafana "Dashboards"
time-series-db -> service alert "Alert rules" -> external twilio "On-call pager"