Observability Stack diagram template
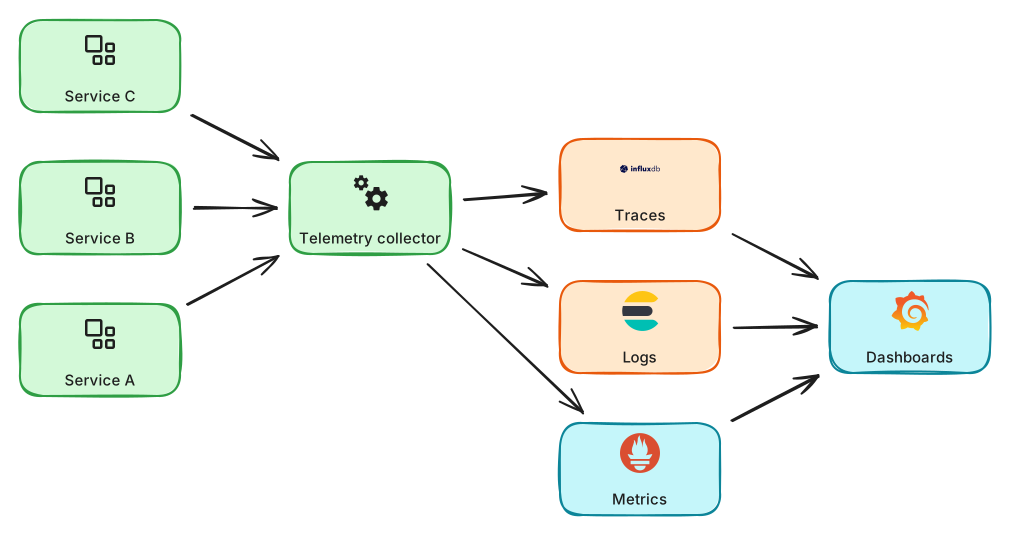
Metrics, logs and traces collected from services into dashboards and alerts.
About this design
Observability asks whether you can understand what a system is doing from the outside, and it rests on three signals. Metrics are cheap numbers over time, good for dashboards and alerts. Logs are detailed records of events, good for the why. Traces follow one request across service boundaries, good for finding where the time went. In this template each service emits all three through a collector, which batches, samples and routes them to the right store: Prometheus for metrics, a log search index for logs and a trace backend for spans. Grafana joins them in dashboards, and alert rules page the on-call engineer. Use the diagram to discuss correlation ids, sampling to control cost, service level objectives that make alerts meaningful, and avoiding dashboards nobody reads.
Diagram as text
This is the source of the diagram, in the ArchBoard diagram DSL. Paste it into Tools, Diagram from text to rebuild or change it.
title "Observability stack"
direction LR
service a "Service A" -> worker otel "Telemetry collector"
service b "Service B" -> otel
service c "Service C" -> otel
otel -> monitor prometheus "Metrics"
otel -> search opensearch "Logs"
otel -> db influxdb "Traces"
metrics -> monitor grafana "Dashboards"
logs -> dashboards
traces -> dashboards
More devops templates

CI/CD Pipeline
Build, test, scan and deploy containers from a pull request all the way to Kubernetes.
Kubernetes Cluster with Ingress
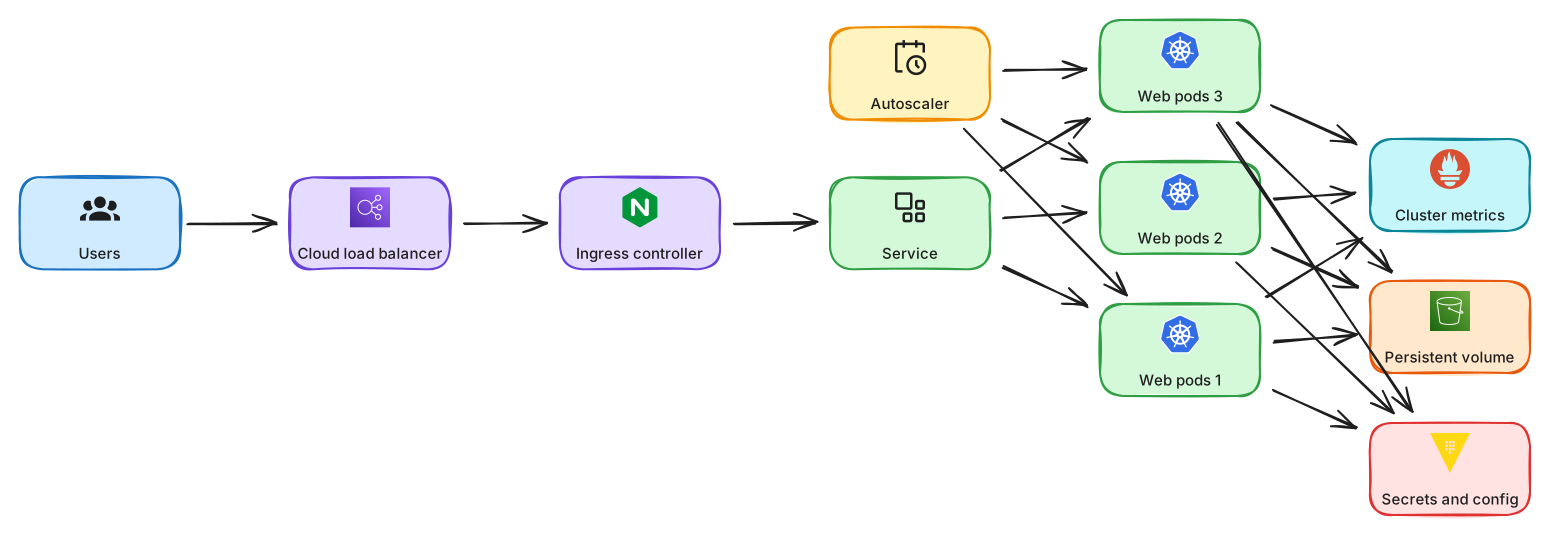
Ingress, services, pods, config and persistent storage inside a Kubernetes cluster.
Feature Flag Rollout
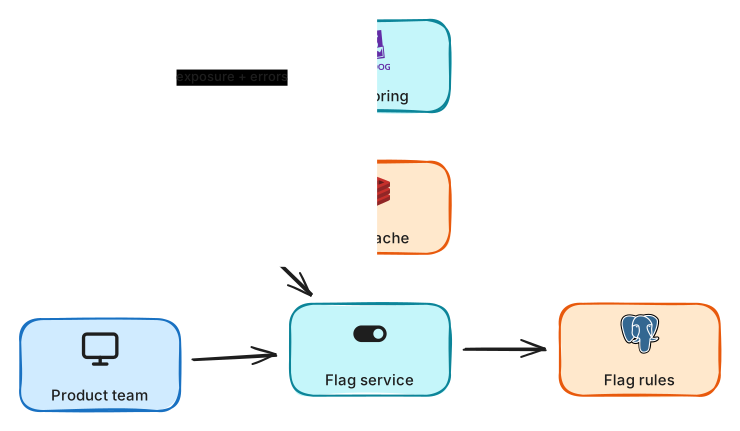
Decouple deploy from release with flags, percentage rollouts and a kill switch.